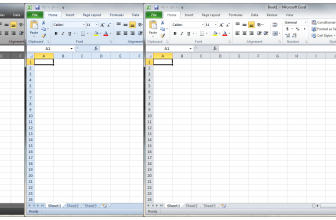
Microsoft Excel 2007 is a popular Microsoft spreadsheet and one of the most-used components of the Office suite. Its basic function is to process numerical data and organize it. The first version of the program, known as Excel 2.0, made its debut on the market in 1987. Excel 2007 is the tenth version of this program. It is slightly different from previous ones, as it introduces the Ribbon interface, which replaces the traditional menu and toolbars.
What Can I Use Microsoft Excel 2007 for?
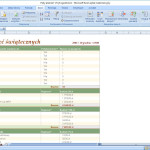
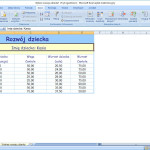
The use cases of Excel are indeed numerous – it is used both at home, to control the budget, as well as in the largest corporations to analyze the company data. They businesses prepare complicated calculations and develop detailed financial plans. In Excel, you can also easily create a monthly balance sheet and prepare various types of bills or statements for printing. Some of the most frequently used features of the program are all kinds of tables – you create numerical data sets in columns and rows, to which you can add appropriate labels, numbers, and formulas that perform even very advanced calculations.
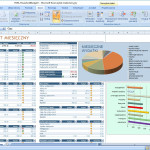
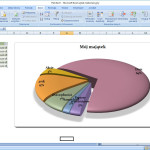
Using Excel 2007, you can also create all kinds of reports, based on the data entered into the spreadsheet or downloaded from external sources. In addition, Excel is often used to create graphic charts – they can be of different types: column charts, line charts, pie charts, doughnut charts, bar charts, area charts etc. Their creation is relatively simple because it is enough to use the chart wizard. Excel can also be very useful for calculations that require a large number of functions.
An Essential Component of the Office Suite
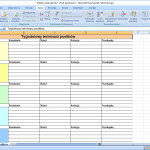
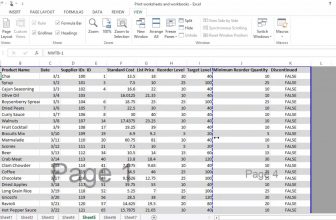
As Excel is part of Office 2007, the Microsoft Office suite, using it should not be too difficult for those who are familiar with Microsoft Word 2007, Microsoft PowerPoint 2007 or Microsoft Outlook. The documents in Excel are simply large tables, which are sometimes so extensive that you can see only a small fragment on the screen. The row and column headers can be modified, by adding, for example, the names of companies or contractors, or the names of people along with their functions.
All the calculations in Excel are performed automatically even after you change the data in the cells. Most people use Excel 2007 at a very basic level, which requires little effort to master. It is the intuitive nature of the program that makes people use it in almost every major office in the world.
However, Excel 2007 has many more applications. Some types of charts are so advanced that they are used mainly by scientists, for example by mathematicians, physicists or economists. Another advanced feature – pivot tables –is usually used to create advanced economic and business analyses.

